Net Cash SomaLogic (SLGC)
One of the better deep value stocks I've seen

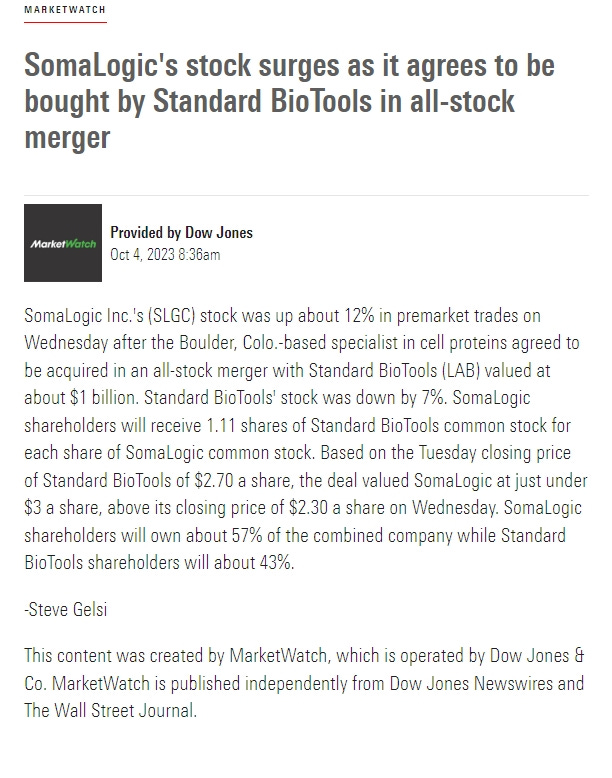
About 3 months after this write-up SomaLogic (SLGC) was bought by Standard BioTools (LAB) for $3.00 a share.
SomaLogic, Inc. ticker symbol (SLGC) is a protein biomarker discovery and clinical diagnostics company in the United States. It serves research and clinical customers with a focus on pharmaceutical and biotechnology companies, and academic research institutions, and facilitates drug development, analysis of clinical trials, and new human biology discoveries by assessing protein-protein and protein-gene networks. The company was incorporated in 1999 and is headquartered in Boulder, Colorado.
When it comes to the good stuff on the balance sheet I always like to get my figures directly from the SEC.gov Edgar database. SomaLogic currently has a market cap of $404 million with the stock trading at $2.15 a share. Net Current asset value is $468 million. Net cash and investments on the balance sheet is $421.8 million.
Cash has increased on the balance sheet from $421.8 million in Q4 of 2022 to $438.5 in Q1 of this year. In the same time total debt has decreased roughly $6 million. So, the stock is trading 4% below net cash and 14% below NCAV.
Let’s breakdown the cash and investments. I’m going to round for simplicity.
Cash and money market $421.8 mil
Commercial paper $58.8
U.S. Treasuries $35.2
Corporate Bonds $11.7
Agency Bonds $12.4
Somalogic states that all these investments have maturity dates of less than one year. So, we have mostly cash and paper as the most liquid assets which is good. The balance sheet is fantastic with a 14.06 current ratio.
On To Growth
I always like to look at the cash flow statement and see if a company is free cash flow positive and see what we are working with on FCF. Unfortunately, they haven’t been FCF positive recently. Cash from operations has been in the negative. They also had two narrow losses in the last two quarters with a -$(.18) per share and a loss of -$(.02).
From 2020 to 2021 the company grew revenue a whopping 46%. From 2021 to 2022 they grew 20%. This year’s full revenue guidance is expected to come in at $92.65 million or a -5% drop year over year respectively. Next years revenue consensus from 4 analysts is a 10% growth rate. The history of solid growth and growth prospects going forward are what separates this deep value from many others I have seen over the years around or below net cash. I actually can’t remember ever seeing a stock trading below net cash with such recent revenue growth.
Major Holders
I decided to do some investigating on the institutions and funds that own the stock. The top mutual fund holder by far is ARK Genomic Revolution ETF (ARKG) with 6% of the shares outstanding. The next closest is 2% by Vanguard Total Stock Market Index Fund. I really like the prospects of this ARKG ETF over the long-term as artificial intelligence advances are becoming more and more helpful in the science industries. I especially like one of the major holdings Ginkgo Bioworks (DNA).
Blackrock and Vanguard Group are the third and fourth largest institutional holders which I believe is a key fact on this one. I was also expecting to see a pure value-oriented fund as a top holder but maybe that just means this one is under the radar. The fund closest to what I would call an active value fund was Tikvah Management LLC that runs a focused portfolio of just 23 names. There may be smaller value funds that have a position, and I just couldn’t see it, as I only saw the top 10 holders in the info I was looking at. A whopping 70% of the stock is held by institutions. This is just another pleasant surprise with this stock. I don’t see this often in small-cap companies of this size. A large institutional base is usually just in mid and large-cap companies.
Critical Critiques
Though I am bullish on this company, I always like to consider and weigh the potential negatives. This is a company that went public in late 2021. We can call this time period the rear end of the easy money days of 0% Fed Funds Rates. Financing expectations were just different back then. Many zombie companies reliant on debt to raise capital are seeing hard times as rates have skyrocketed.
I don’t see the zombie scenario with this one. They have a $500k debt at 11.5% and not much other long-term debt. Most of the long-term debt is lease debt and a milestone contingent consideration. Total long-term debt is $5.4 million. However, the timing of when they went public is something to consider. They are incredibly well capitalized so I am not concerned about debt at this time. The stock also has not performed well with the company being unprofitable. The stock has sunk since the IPO. It has stabilized since December of last year but the overall trend has been down.
Being unprofitable the pressure is on to grow or maintain gross profit margins. Trailing twelve month gross margins are 55.6% which isn’t bad. From the data I could find over the years gross margins have been trending down. The 55% is actually pretty good compared to recent years. In 2022 they had 44% gross margins.
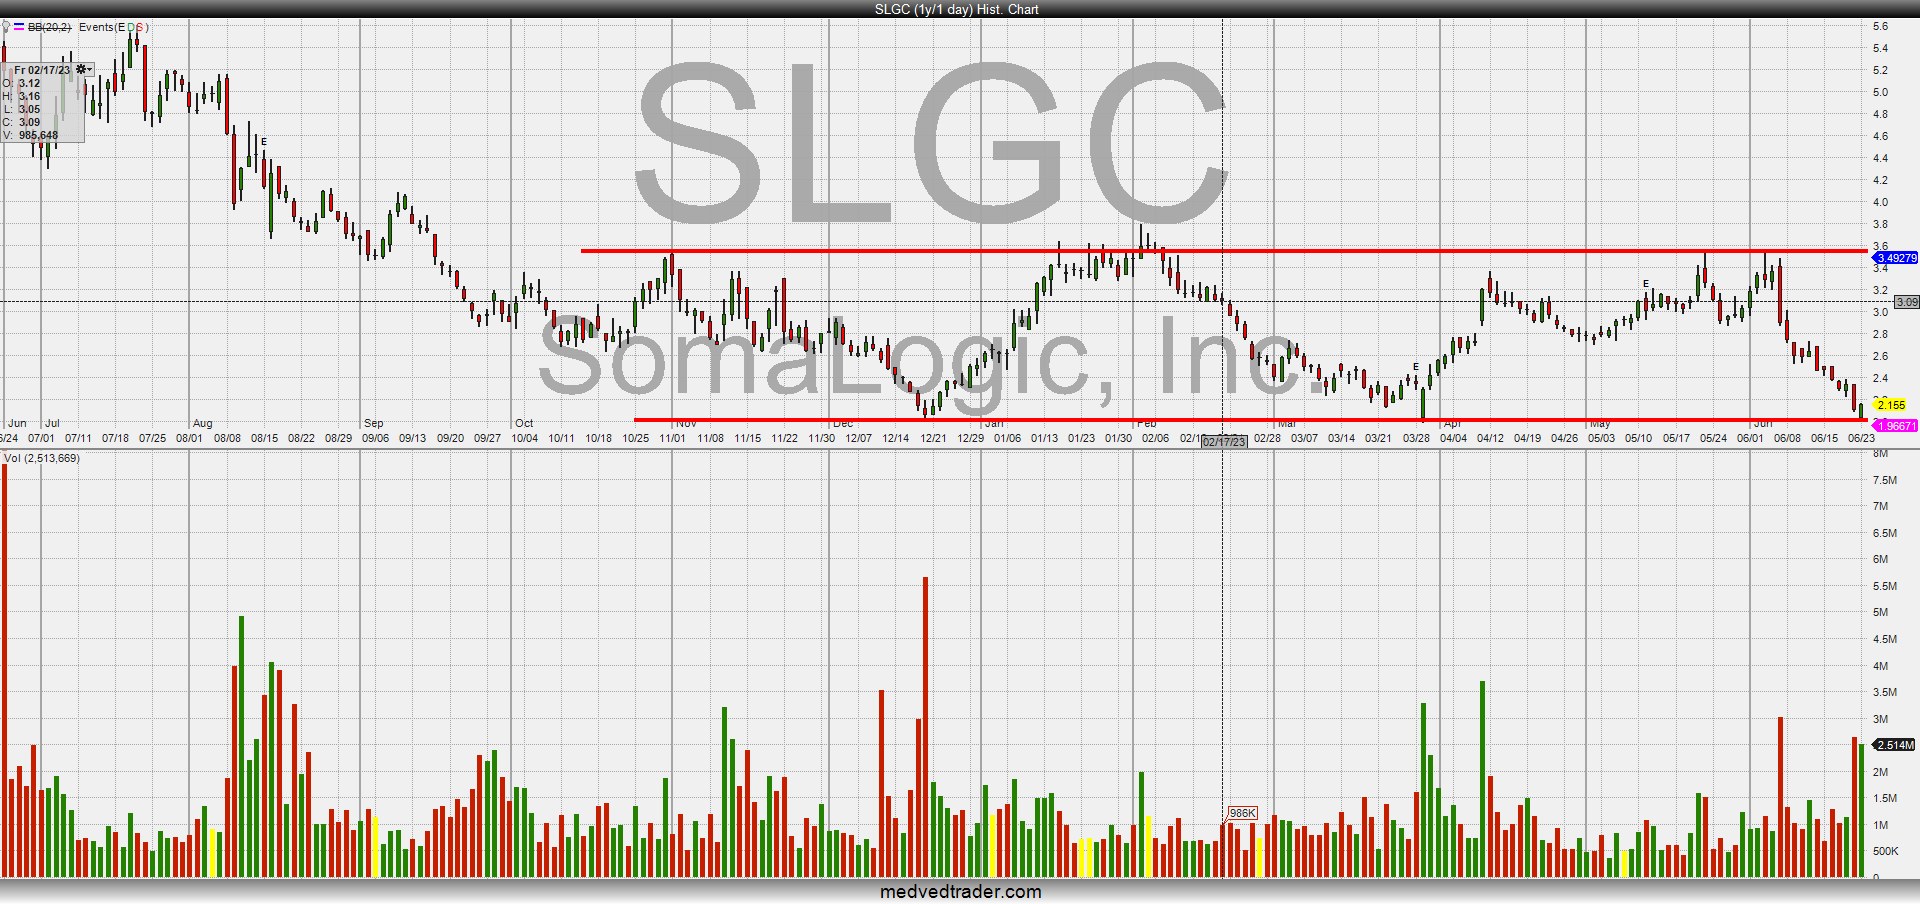
Technical Analysis
While a down-trending stock definitely does not deter us as value investors I found the technicals worth noting as well. As I said the stock has stabilized for roughly 7 months now trading in a range of $2.00 roughly to $3.60. I found it interesting that the stock found support at the $2.00 mark twice so far. Once it was $2.02 then $1.98. This is the third time here the $2.00 level has been tested. So far it is holding. I think if we get a couple days where the stock closes the day below $1.98 the momentum may be stalled and better prices will be coming. But, so far so good.
Full Disclosure: I have a position long in July call options and may buy August or later montly calls in the future.